
Crowdtech Insights
Take advantage of all Crowdtech products and the seamless collaboration between these tools for comprehensive and versatile market research.
Flexible research methods
Innovative technology
Reliable and secure data
Crowdtech's survey technology enables the creation of mobile-friendly, intuitive, and visually appealing online surveys for short-term quantitative market research. By prioritizing the respondent experience, participating in an online survey becomes effortless and captivating. This ensures that every question, regardless of the research theme, receives a response, fostering a strong and enduring relationship with your customers.
Gain a deep understanding of your target audience's needs, uncover insights on current trends and opportunities, and maintain control over your market research with Crowdtech Survey. Benefit from a variety of interactive question types to ask the most relevant question.

![Brandweer Kennemerland[1]](/media/qcfd4mr0/brandweer-kennemerland-1.png "Brandweer Kennemerland[1]")
![Uwv[1]](/media/uzah2akj/uwv-1.png "Uwv[1]")
![Albelli[1]](/media/aaqdd2aw/albelli-1.png "Albelli[1]")
![Albertheijn[1]](/media/b1kiu4ii/albertheijn-1.png "Albertheijn[1]")
![Persgroep[1]](/media/w2cjliyn/persgroep-1.png "Persgroep[1]")
![Hudsons Bay Company[1]](/media/rf1ms3il/hudsons-bay-company-1.png "Hudsons Bay Company[1]")
![Coca Cola[1]](/media/egpp1rx5/coca-cola-1.png "Coca Cola[1]")
![Freo[1]](/media/du5mx1uz/freo-1.png "Freo[1]")
![Aegon[1]](/media/mrbhyrur/aegon-1.png "Aegon[1]")
![Ident[1]](/media/zq0npdyj/ident-1.png "Ident[1]")
![Jumbo Supermarkt[1]](/media/s4sja2l0/jumbo-supermarkt-1.png "Jumbo Supermarkt[1]")
![Maersk[1]](/media/2gjf0zec/maersk-1.png "Maersk[1]")
![Manpower[1]](/media/vqdjmqdp/manpower-1.png "Manpower[1]")
![Ret[1]](/media/pw4cuthr/ret-1.png "Ret[1]")
![Nestle[1]](/media/jkhdjspw/nestle-1.png "Nestle[1]")
![Media Markt[1]](/media/d4elynrg/media-markt-1.png "Media Markt[1]")
![Sanoma[1]](/media/rk2n5b5q/sanoma-1.png "Sanoma[1]")
![Springer[1]](/media/koofhpqi/springer-1.png "Springer[1]")
![Tata Steel[1]](/media/vt0hryra/tata-steel-1.png "Tata Steel[1]")
![Unicef[1]](/media/4xrh1cwn/unicef-1.png "Unicef[1]")
![Philips[1]](/media/hfjb4xm1/philips-1.png "Philips[1]")
![G4s[1]](/media/0idb2th0/g4s-1.png "G4s[1]")
![Heineken[1]](/media/zbrjmphy/heineken-1.png "Heineken[1]")
![Wwf[1]](/media/qjactsow/wwf-1.png "Wwf[1]")
![Klm[1]](/media/nu3bvtmg/klm-1.png "Klm[1]")
![Yakult[1]](/media/mo1pexut/yakult-1.png "Yakult[1]")
![Mcdonalds[1]](/media/2kblvo23/mcdonalds-1.png "Mcdonalds[1]")
![Abn Amro[1]](/media/jnrpkrbg/abn-amro-1.png "Abn Amro[1]")

With Crowdtech Survey, you can access your surveys anytime and anywhere. No need to install additional software, our technology is compatible with any device. Stay updated on your research goals in real-time by monitoring results online and retain control over your research projects. You ask the right questions, and we ensure the security of your data.
Crowdtech Survey provides a wide range of functionalities, including over 20 different question types. With advanced routing, randomized grouping, quotas, referrals, and links, Crowdtech Survey is suitable for all types of online quantitative research. It also supports surveys in more than 20 different languages for international studies.
The online reporting environment provides real-time results presented in clear and customizable charts and tables. You can filter these results based on given answers, uploaded data, and date. The reports can be downloaded in PowerPoint format. Additionally, the data is always accessible in SPSS, Excel, or PDF format through the download center. There is also an extensive online response analysis feature available.

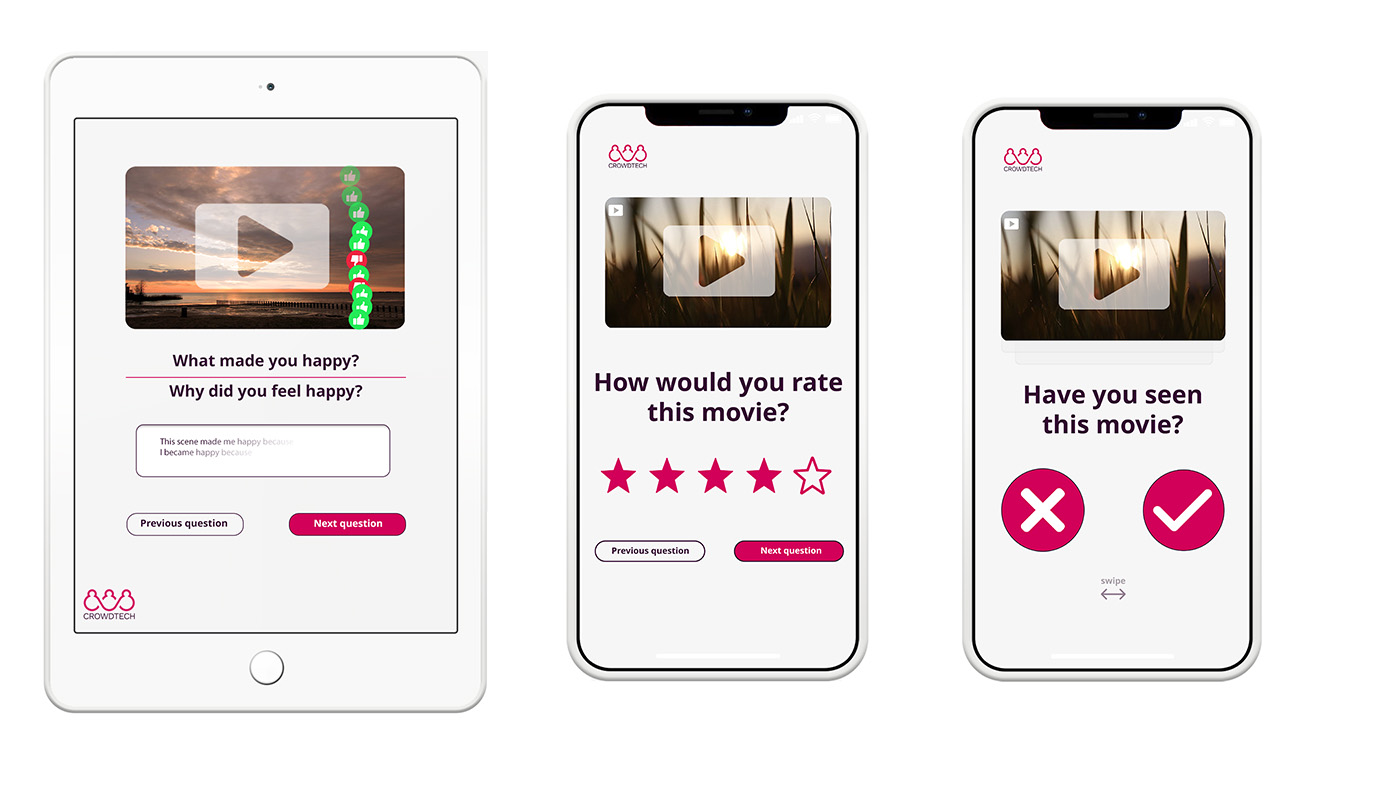
Respondent-friendly surveys
To ensure a high response rate and a positive experience for respondents, it is crucial for surveys to be user-friendly. By incorporating visual question types like hotspot questions, ranking questions, or utilizing direct feedback, surveys become engaging and hold the respondent's attention. Questionnaires are presented in your organization's branding.
Crowdtech's survey platform is designed to be user-friendly and adaptable, allowing you to effortlessly conduct even the most complex and challenging projects. With over 20 diverse question types available in Crowdtech Survey, and support for more than 20 languages for international surveys, you can truly reach a global audience. Advanced features such as routing, randomization, quotas, referrals, links, and integrations make Crowdtech Survey suitable for any type of online quantitative research, all while maintaining your company or client's branding.
The online reporting environment provides real-time results presented in clear and customizable charts and tables. You can easily filter these results based on answers or CRM system input. Reports can be downloaded in PowerPoint format or accessed in SPSS, Excel, and PDF formats.
We provide round-the-clock support through our 24/7 support system. Our help desk is accessible via phone and chat, and you can also find a comprehensive online manual on our website. If you prefer to directly contact one of our Crowdtech specialists, simply send us an email, and we will respond to your inquiry promptly!


Crowdtech's technology is designed with the needs of both respondents and researchers in mind, resulting in an intuitive and user-friendly platform for all users. We prioritize the respondent's experience, aiming to achieve high response rates and provide an enjoyable and accessible participation. Our surveys are visually appealing, creatively designed, and easy to complete.
With Crowdtech, the entire research process is seamlessly conducted within a single platform by a single user. You can script and design the questionnaire, select samples, conduct fieldwork, analyze data, and create and manage dashboards all in one place. Crowdtech is the ideal platform for your research needs.
Crowdtech Survey not only serves as a tool to understand customer desires and needs but also provides opportunities for internal communication and feedback. For instance, you can create surveys to gather employee opinions on working conditions or solicit feedback on recent company changes. By giving employees a voice, managers can identify issues and implement improvements to enhance the work environment and employee experience.
Furthermore, Crowdtech Survey can be utilized to measure customer satisfaction post-purchase. Sending surveys to customers after a sale allows organizations to receive valuable feedback on product and service quality, the customer experience, and the provided service. This feedback can lead to enhancements and stronger customer relationships.
Crowdtech Insights is specifically designed to help organizations elevate their market research to the next level by offering a combination of products and services that perfectly align with your needs. This allows you to benefit from seamless integration and efficiency when conducting both qualitative and quantitative research. This enables your organization to gain profound insights and better anticipate the wants and needs of your customers.
Here is the complete offering of Crowdtech: